
When a department asks for more office space, there is usually a good reason behind the request. People cannot find a desk, meeting rooms are full, or the team is growing. In my role as Product Owner Data-Driven Facilities at Alliander, I want to understand that experience well enough to make a sensible decision about it. Adding space is a substantial commitment, and the busiest day of the week only tells part of the story.
At Alliander, colleagues regularly struggled to find a suitable desk or meeting room on Tuesdays and Thursdays. Yet on other days, substantial parts of the workplace stood unused. Before expanding, I wanted to understand how much of the pressure came from a shortage of capacity and how much came from the way we distributed and used it.
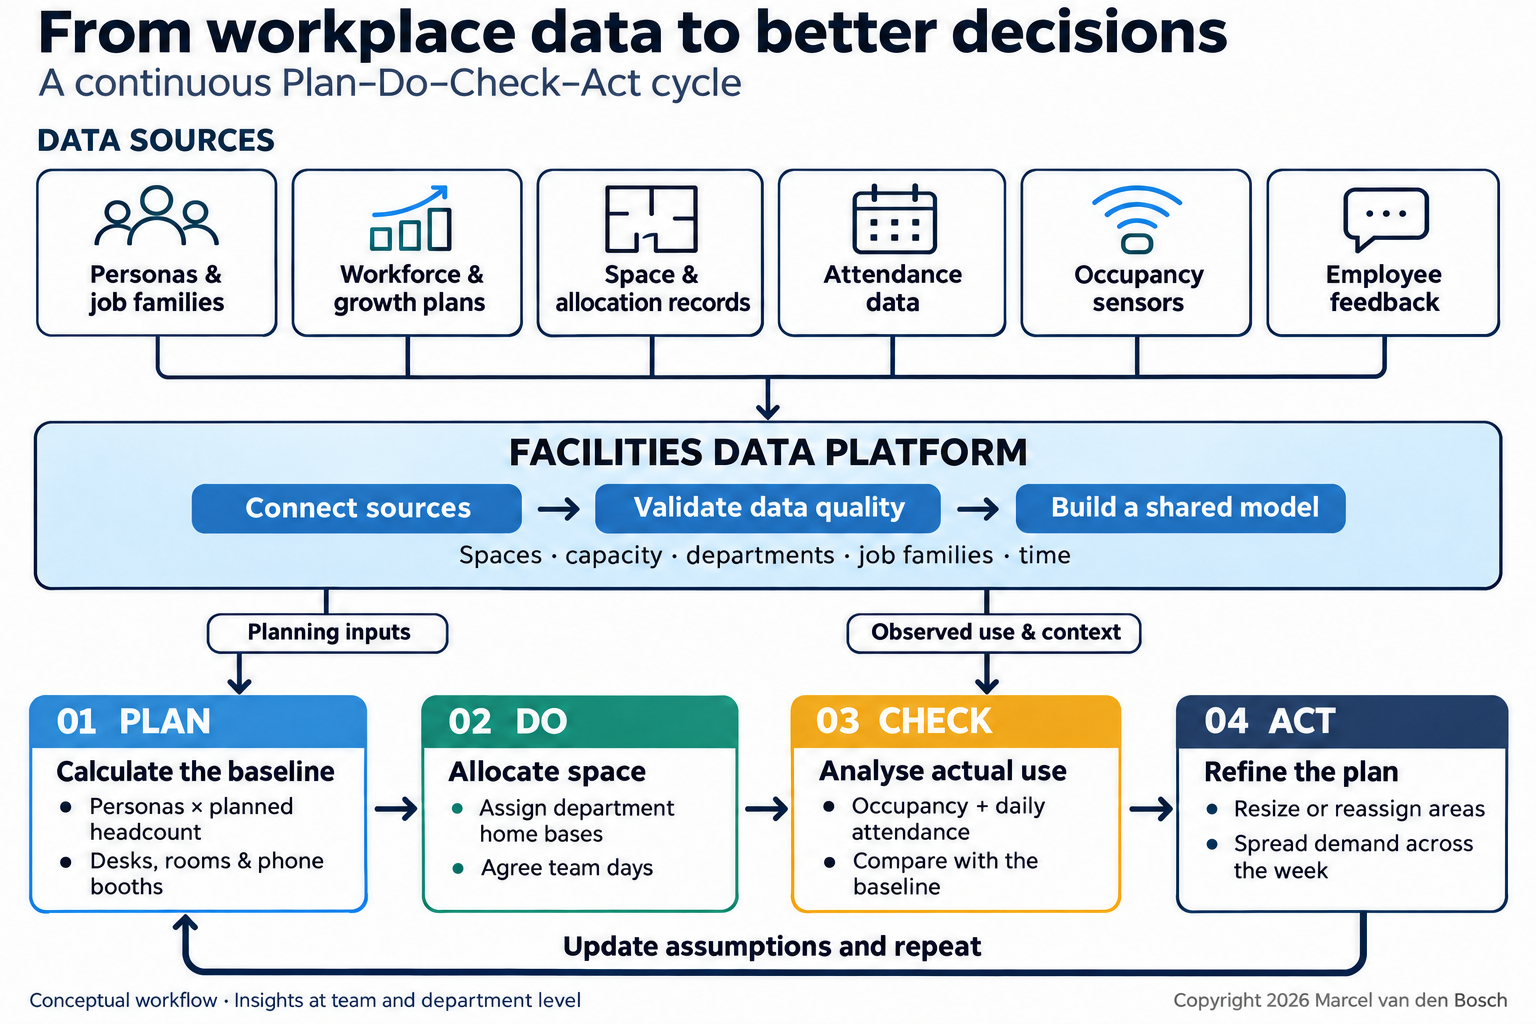
That took us from analysing the work people do to calculating a baseline allocation, then testing it against actual attendance and occupancy. It also shaped how I think about a facilities data platform: the useful connections become clear when you have a real decision to make.
Working out what a department needs
We started with functions and teams. Headcount matters, of course, but two departments with the same number of employees can have quite different workplace requirements. To account for those differences, we developed a set of personas and mapped employee job families to them. Think of Tim the Mechanic and Andy the Scrum Master: recognisable profiles that help translate the composition of a department into the facilities it needs.
For each persona, we defined requirements for workstations, meeting rooms and phone booths. This gave us a consistent basis for calculating demand across organisational units, while keeping the different types of facilities separate. A department's need for desks should not obscure its need for places to meet or make a call.
We also needed to look ahead. Through a questionnaire, we asked departments how much growth they expected in specific job families, and considered their answers alongside the forecasts and budgets in strategic business plans. The composition of that growth matters: adding more employees in one job family can produce a different demand profile from adding the same number in another.
Conceptually, the calculation for each facility type was:
Department demand = sum of (planned employees per job family × the mapped persona's facility requirement)
Those requirements represent capacity allowances that account for shared use. Someone needing access to a meeting room does not imply a dedicated room for that person. Applying the requirements consistently and aggregating them by organisational unit gave us a baseline plan for allocating workplaces to departments.
It also made the reasoning behind the plan visible. We could see which job families contributed to demand, which persona assumptions we had applied and how much growth we had allowed for. That gave us something concrete to revisit when reality turned out differently.
Putting the baseline to the test
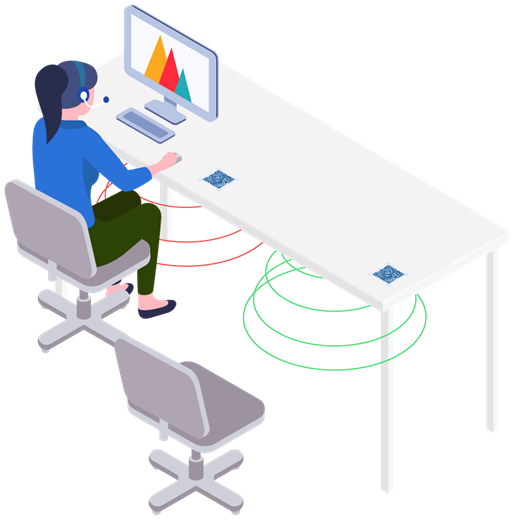
Once the workplaces were allocated, we could start comparing the plan with what happened during the week. Sensors showed how the monitored desks, rooms and areas were being used. Access data, combined with organisational information, showed which departments and job families were present each day. The allocation records supplied the context: how much capacity was available, and to whom it had been assigned.
These sources describe different things. Someone entering a building has not necessarily occupied a desk, and the total number of visitors over a day is not the number present at the same time. I want to examine attendance and occupancy alongside each other without suggesting that they identify who sat at a particular desk. Our purpose was to understand patterns at team and organisational level; tracking individual employees was never the objective.
With that distinction clear, the analysis becomes useful. Comparing occupied desks with available desks in the same area and time interval helps locate the pressure. Looking across weekdays shows whether it keeps recurring. Within a day, we can examine whether an area is busy for hours or only during a short peak. A weekly average can easily hide either situation.
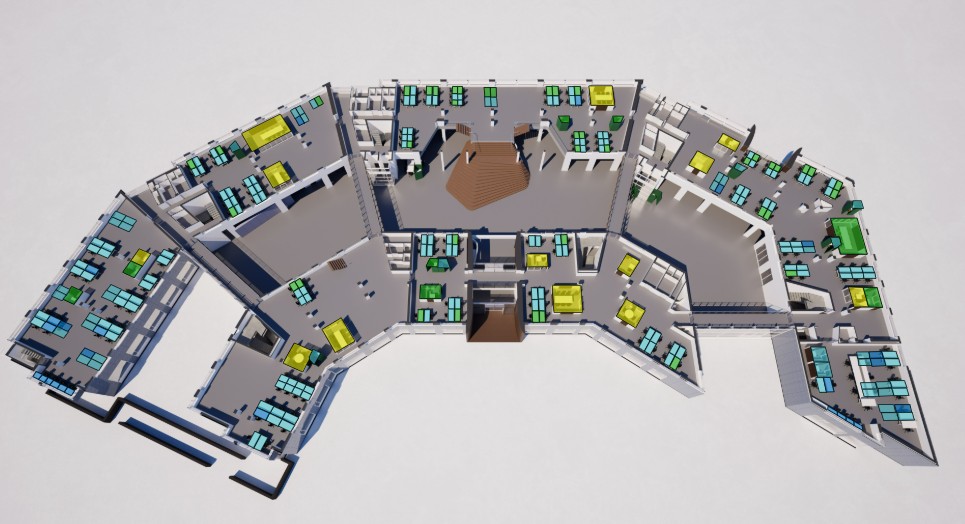
Bringing those readings together with department and job-family attendance patterns helps us assess whether an allocation still fits. If pressure keeps recurring, we have a reason to investigate the size of the area, its allocation on particular days, or the working arrangements behind the demand. Surveys and employee feedback help explain what the measurements cannot: whether colleagues can find the right kind of space and work effectively with their teams.
The same baseline can then be recalculated when workforce plans change. We can explore what a different mix of job families would mean for desks, meeting rooms and phone booths before changing the allocation. After making a change, we can compare occupancy patterns and ask colleagues whether things have improved. The initial plan becomes something we can test and refine.
The biggest breakthrough happened after the analysis
At Alliander, the data showed that departments used their allocated areas quite differently. Historical allocations, largely based on department size, did not always reflect actual use, and demand varied considerably by weekday.
At locations under pressure, including our headquarters, this led to dynamic space allocation. A team's home base, its designated work area, could differ by weekday so that the available space better matched attendance. At regional locations with less pressure, allocations generally stayed the same throughout the week.
Making that work required regular conversations. Facilities Business Partners reviewed arrangements with organisational units, and every three to four weeks Facilities discussed occupancy data and the implementation of agreements with regular contacts. Team days were adjusted; areas were resized or reassigned where needed. The measurements gave those conversations a factual starting point, and the follow-up turned the discussion into changes people could experience.
Attendance became more evenly distributed from Monday to Thursday. Friday remained a challenge, partly because many colleagues choose it as their non-working day when working part-time. Even so, we used the buildings more efficiently during most of the week, and expanding office space proved unnecessary. Teams became easier to find, and days for working together gained more structure.
For me, that is the most important outcome. We could use the evidence to improve both the allocation of space and the experience of coming into the office. Those conversations are where the analytical work earns its value.
Making the connections reusable
This experience also explains my interest in a facilities data platform. The baseline, allocation records, occupancy readings and workforce plans all become more useful when we can relate them consistently. I want those connections to be available each time a question arises, without having to reconstruct the analysis from separate sources.
My vision has three stages: source ingestion, a shared data model and reusable analytical datasets. Ingestion retains the origin and timing of the records. The shared model connects buildings, floors, spaces, capacity and organisational units. Analytical datasets provide agreed metrics for dashboards, scenarios and other applications. This is the direction I have in mind for the platform, rather than a description of a particular technology stack already implemented at Alliander.
The details underneath it matter. Historical readings need to be interpreted against the capacity and allocation that applied at the time. Definitions need owners, and data quality needs to remain visible. A missing sensor reading, for example, must be distinguishable from an empty space. Otherwise, a technical gap can quietly become a workplace conclusion. Aggregation and access controls should also support the focus on team and organisational patterns from the outset.
With that foundation, I see opportunities to bring in service requests, maintenance, energy use and costs. We could then explore more of the relationship between how buildings are used, the services they need and the costs of operating them.
Where I want to take it next
Analysing the data and updating space plans still takes considerable effort. Alliander's ambition is to use AI to automate more of the analysis and make insights available sooner. I see potential in identifying changing patterns, flagging areas that deserve attention and preparing scenarios for review. Clear definitions, reliable inputs and traceable calculations remain essential to making those results useful.
What started with busy Tuesdays and Thursdays has become a much broader way of thinking about workplace decisions. The persona-based baseline gives us a reasoned starting point. Attendance, sensors and employee feedback let us test it. Regular conversations give us a way to act on what we learn.
That is what I want a facilities data platform to support: being able to explain why we allocated space in the first place, see how it is working and make a better decision when circumstances change.